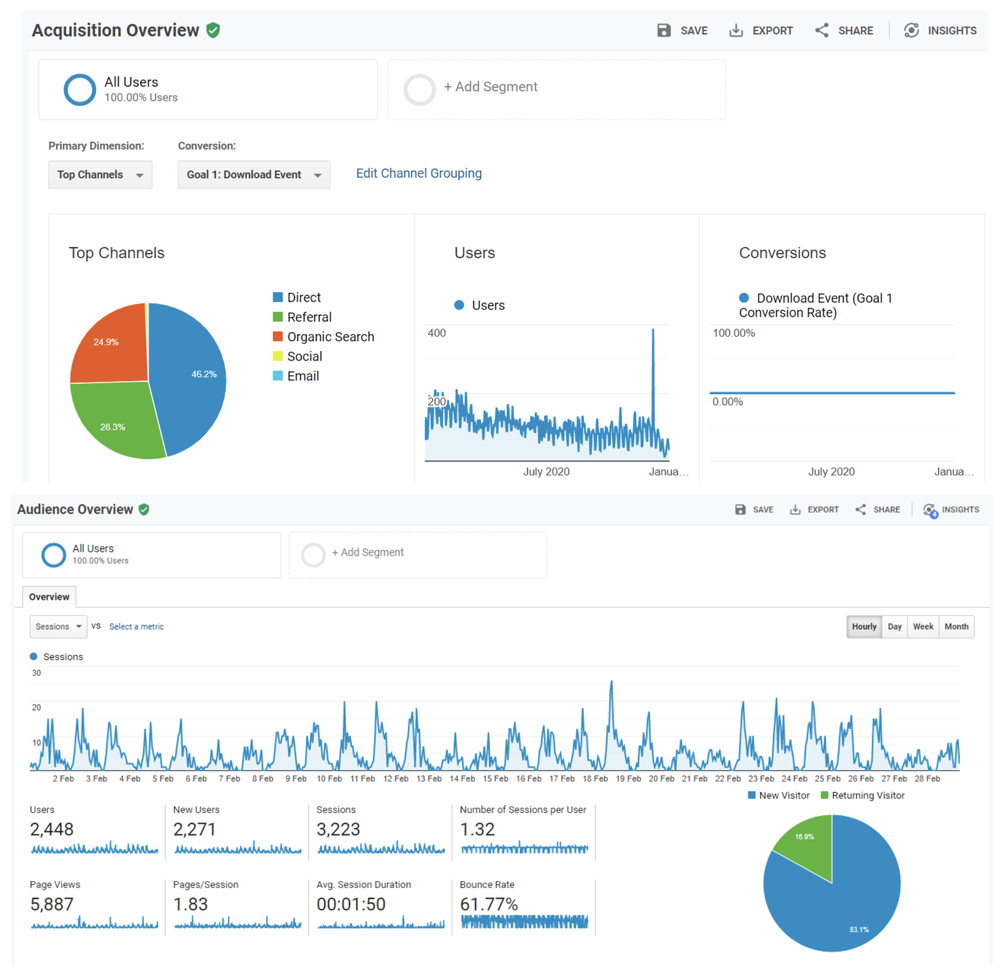
The aim of web analytics and behaviour tracking is to build a deeper understanding of digital audiences and inform ongoing content strategies. I’ve developed analytical approaches for a range of websites, digital services and content teams, using a variety of digital analytical tools to gather data. I start with stakeholder and organisational needs, performance reporting requirements and content management methods, and implement the most appropriate tools to gather the most insightful data.
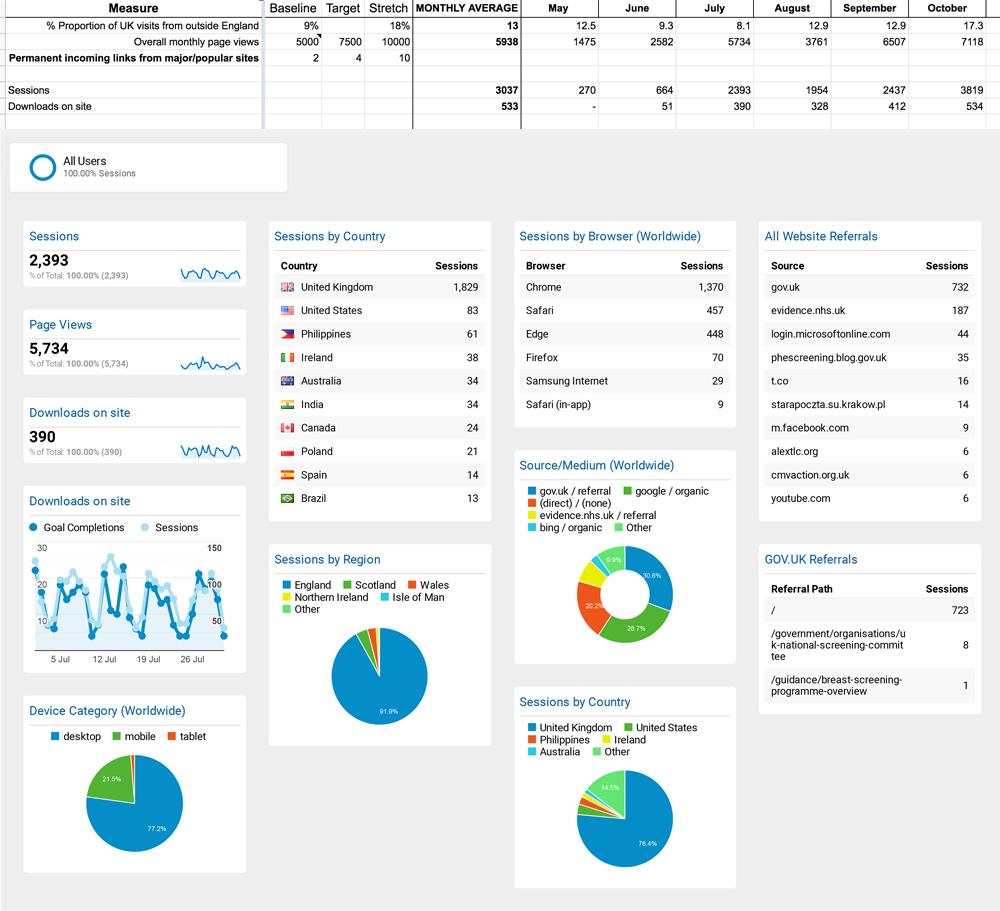
I developed a custom reporting dashboard while working at the UK NSC, to track and report consultation data to project stakeholders. It also formed informed our overall content strategy, complimenting our user research with hard quantitative data on how real users were using the site.
I also set up custom event tracking using Google Tag Manager, to fire custom event data that could feed into our Google Analytics dashboard. A key metric was website downloads, since this indicated how many people were engaging with consultations on the website. Being able to track downloads against core data such as sessions and time spent on page, we could investigate the number of website visitors engaging with consultations as a portion of overall visitors sorted by region. These were key indicators of success for the digital service.
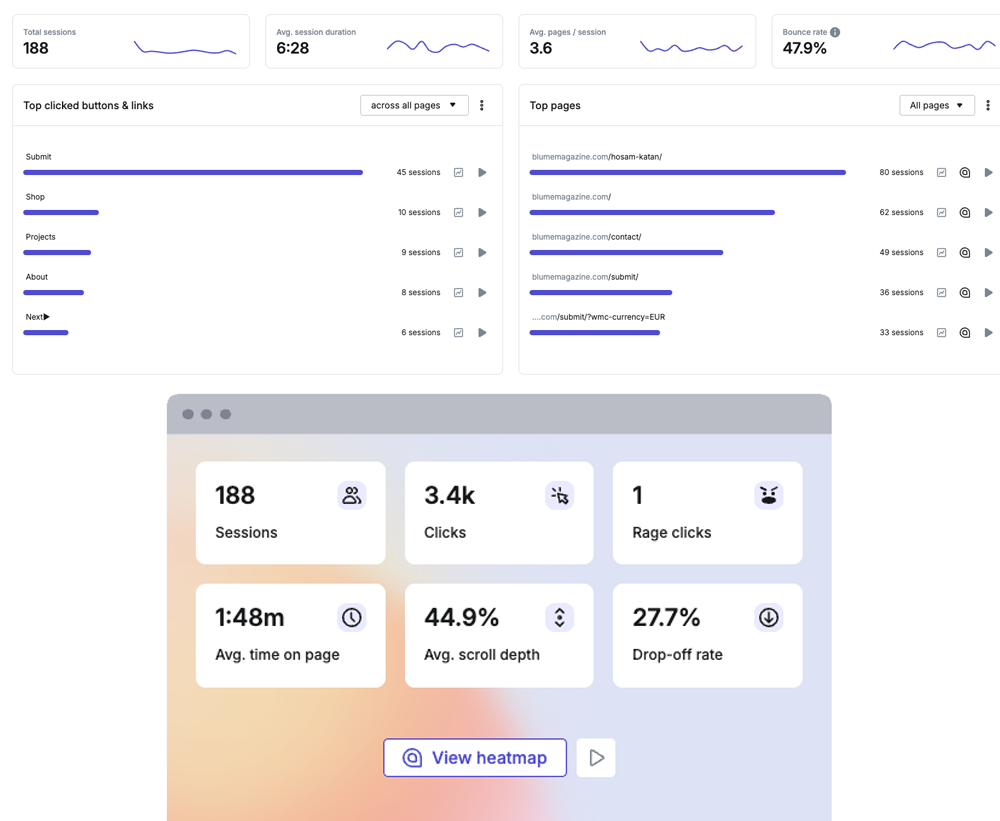
As well as Google Analytics and Tag Manager, I like to set up Hotjar on the websites I manage. It allows more granular reporting detail for actions taken by users on the website. Most usefully, it allows you to track how users are engaging with pages through click events, including heatmaps showing where and how users are clicking and scrolling through particular webpages.