- Home >
- Content design portfolio >
- User research
User research
I’ve worked in teams undertaking primary user research with usability testing methods to develop user-focused digital services. During my time coordinating the development of the new UK National Screening Committee’s (UK NSC) digital service on GOV.UK, I collaborated with dedicated user researchers and managed our overall user research workflow and recruitment process.
Strategic user research processes & digital service development
Within our project team, integrating effective user research methods into the overall development workflow meant ensuring there was clear and effective communication between content designers and user researchers. The main aims of our user research were to test new designs, challenge our assumptions, and ensure the digital service appropriately met the core needs of the different user groups that would use the service.
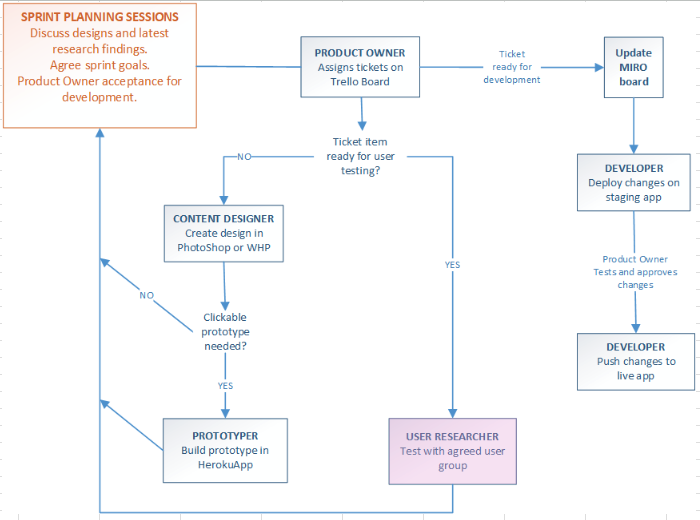
In order to make our user research process as efficient as possible, we included regular user research de-briefs and discussions in our weekly sprint meetings with the project team. This gave user researchers an opportunity to present key insights and discuss details with content designers and the delivery manager. That meant we were able to act upon the data in a timely and efficient manner, and discuss as a team how best to move forward with our ongoing user research and service development process. Below is an illustration of our overall workflow, and how user research fit in.
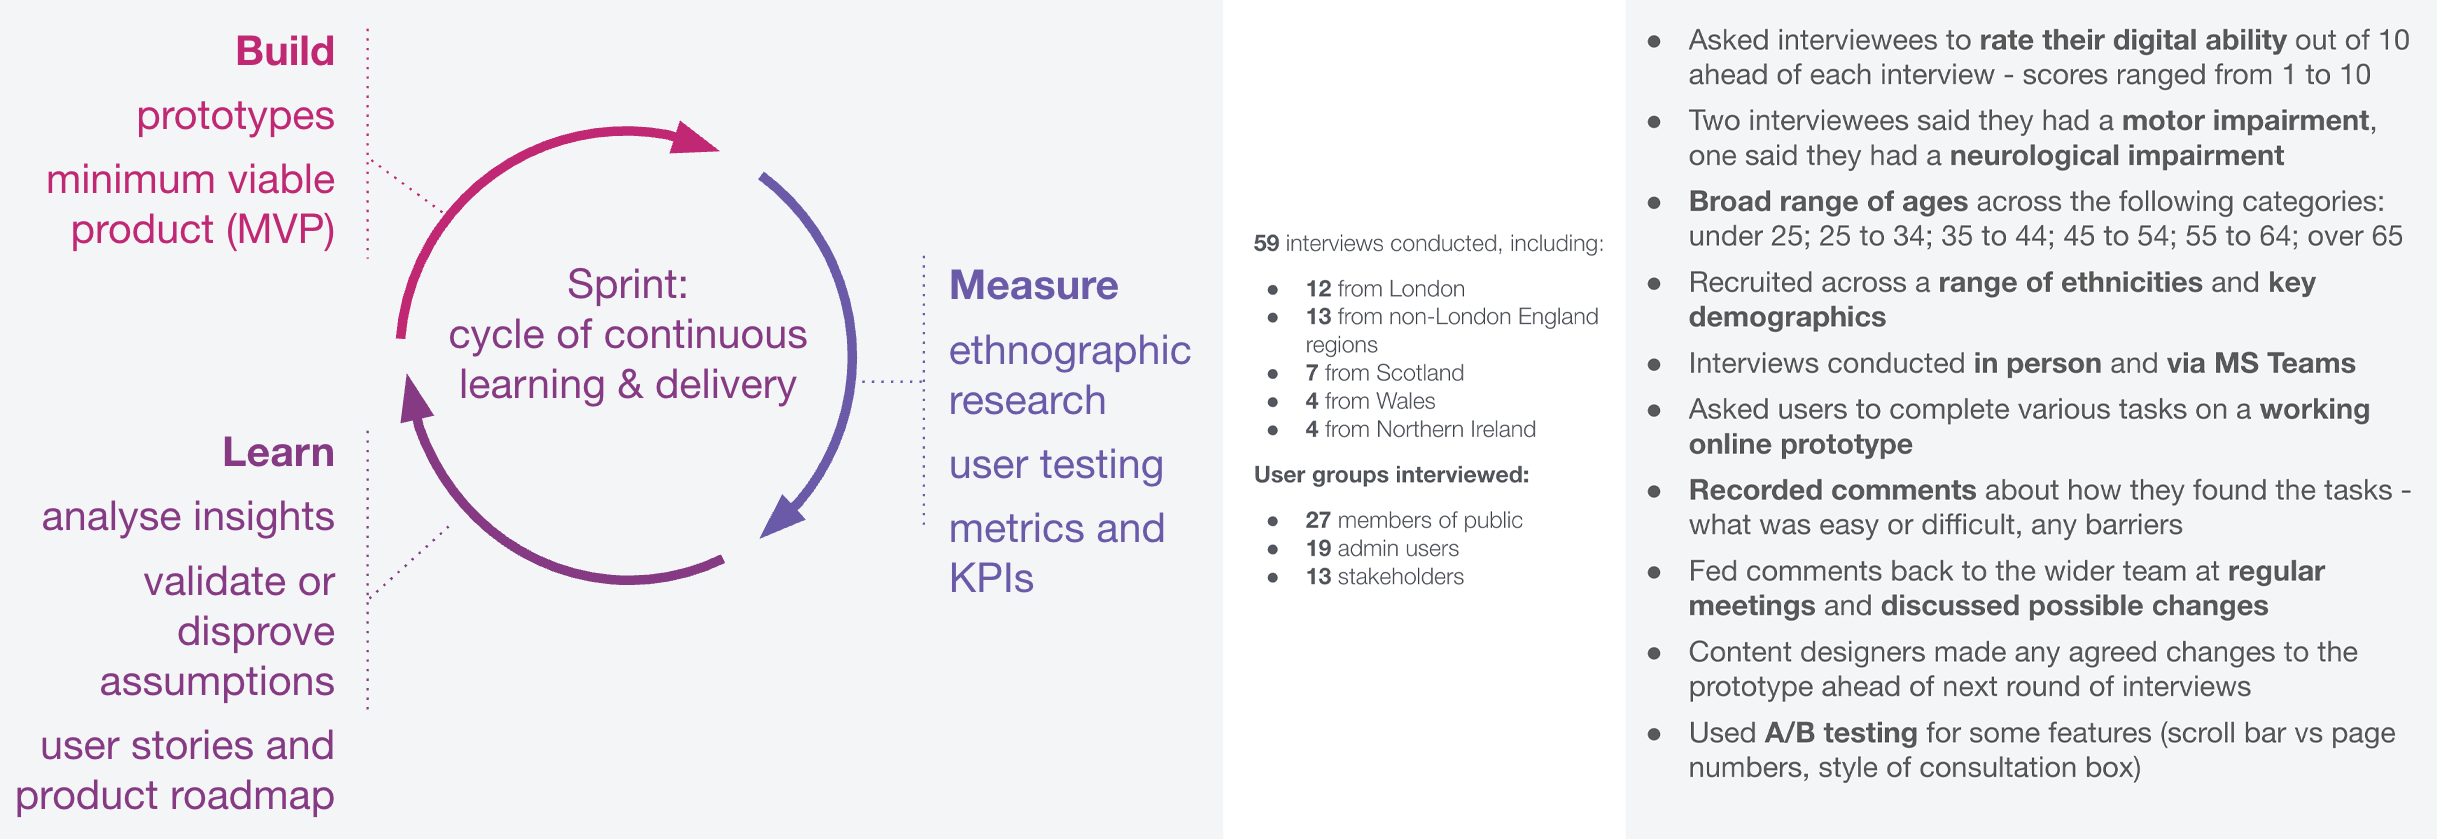
Recognising we needed to ensure the user research team could convey their work to the wider team in the most useful way possible, I brainstormed with our user researchers to design a reporting methodology that could quickly and easily give the team top-level insights as well as finer details when needed. We decided to implement a feedback scale that user researchers could use to grade the data they got from usability testing. This allowed us to quantify the insights we were getting and use this to prioritise feedback and inform our content strategy. Our user research team then came back with a highly organised feedback template which they used to measure data and share insights with the team.
Detailed user research findings put together in collaboration with the user research team – the research data provided by the user research team is sorted into reports we could use to feed back into designs and discuss with stakeholders:
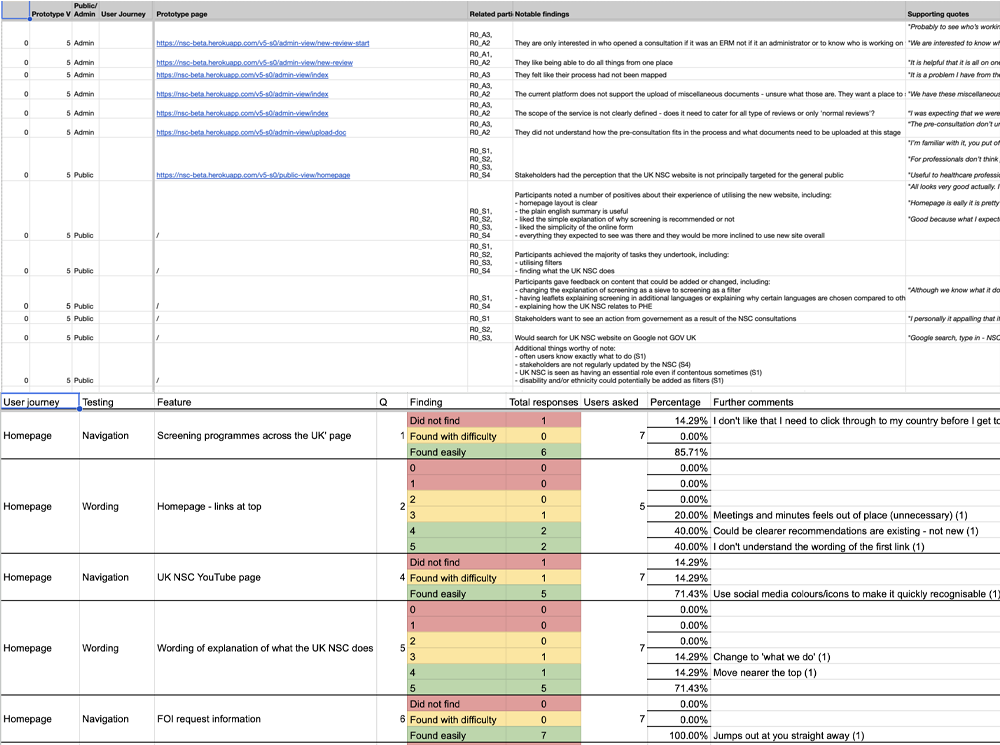
While this kind of document worked great for dissecting specific user research rounds with the project team, I needed to take things a step further to present top-level overviews across different user research rounds throughout entire project phases. This would allow the project team and business stakeholders to quickly see a macro-level view of our main user research findings, and how they informed our designs and overall content strategy across whole segments of the project. It would also allow us to succinctly present this data to assessment panels when undergoing our GDS service assessments.
To achieve this, I developed a top-level reporting dashboard that documented key user research take-aways throughout entire project phases. In practice, this meant listing an overview of user research insights across the private beta and public beta phases as a whole. My approach was to split each user research insight into sections, showing a) the user journey that was tested; b) whether the feedback was positive or negative; c) notable findings; and d) the content design actions taken based on the feedback.
Participant recruitment methodologies & testing appropriate users
In addition to overseeing the above processes and collaborating with our project’s user research team, I also managed our participant recruitment and made sure we were interviewing the most appropriate audience segments to test our designs. This meant considering macro service data and organisational needs to inform our participant recruitment strategy. For example, a core requirement of the UK NSC digital service is to serve the needs of users across the four UK countries. As such, we needed to ensure appropriate regional representation across our research participants. The same is true of testing users with accessibility needs or low digital literacy rates.
Some of our key considerations when deciding who to recruit and test included:
- Regional representation: Testing users across the four UK countries, and recruiting users from outside London when testing users from England.
- Participant diversity and socio-economic backgrounds: Making sure we tested a representative sample of users across age, ethnicity and demographics.
- Access needs and technical abilities: Recruiting across a range of digital literacy scores, testing users with accessibility and assistive technology needs.
- User groups and audience segments: Tailoring our approach across predefined user groups and users with different aims and needs.
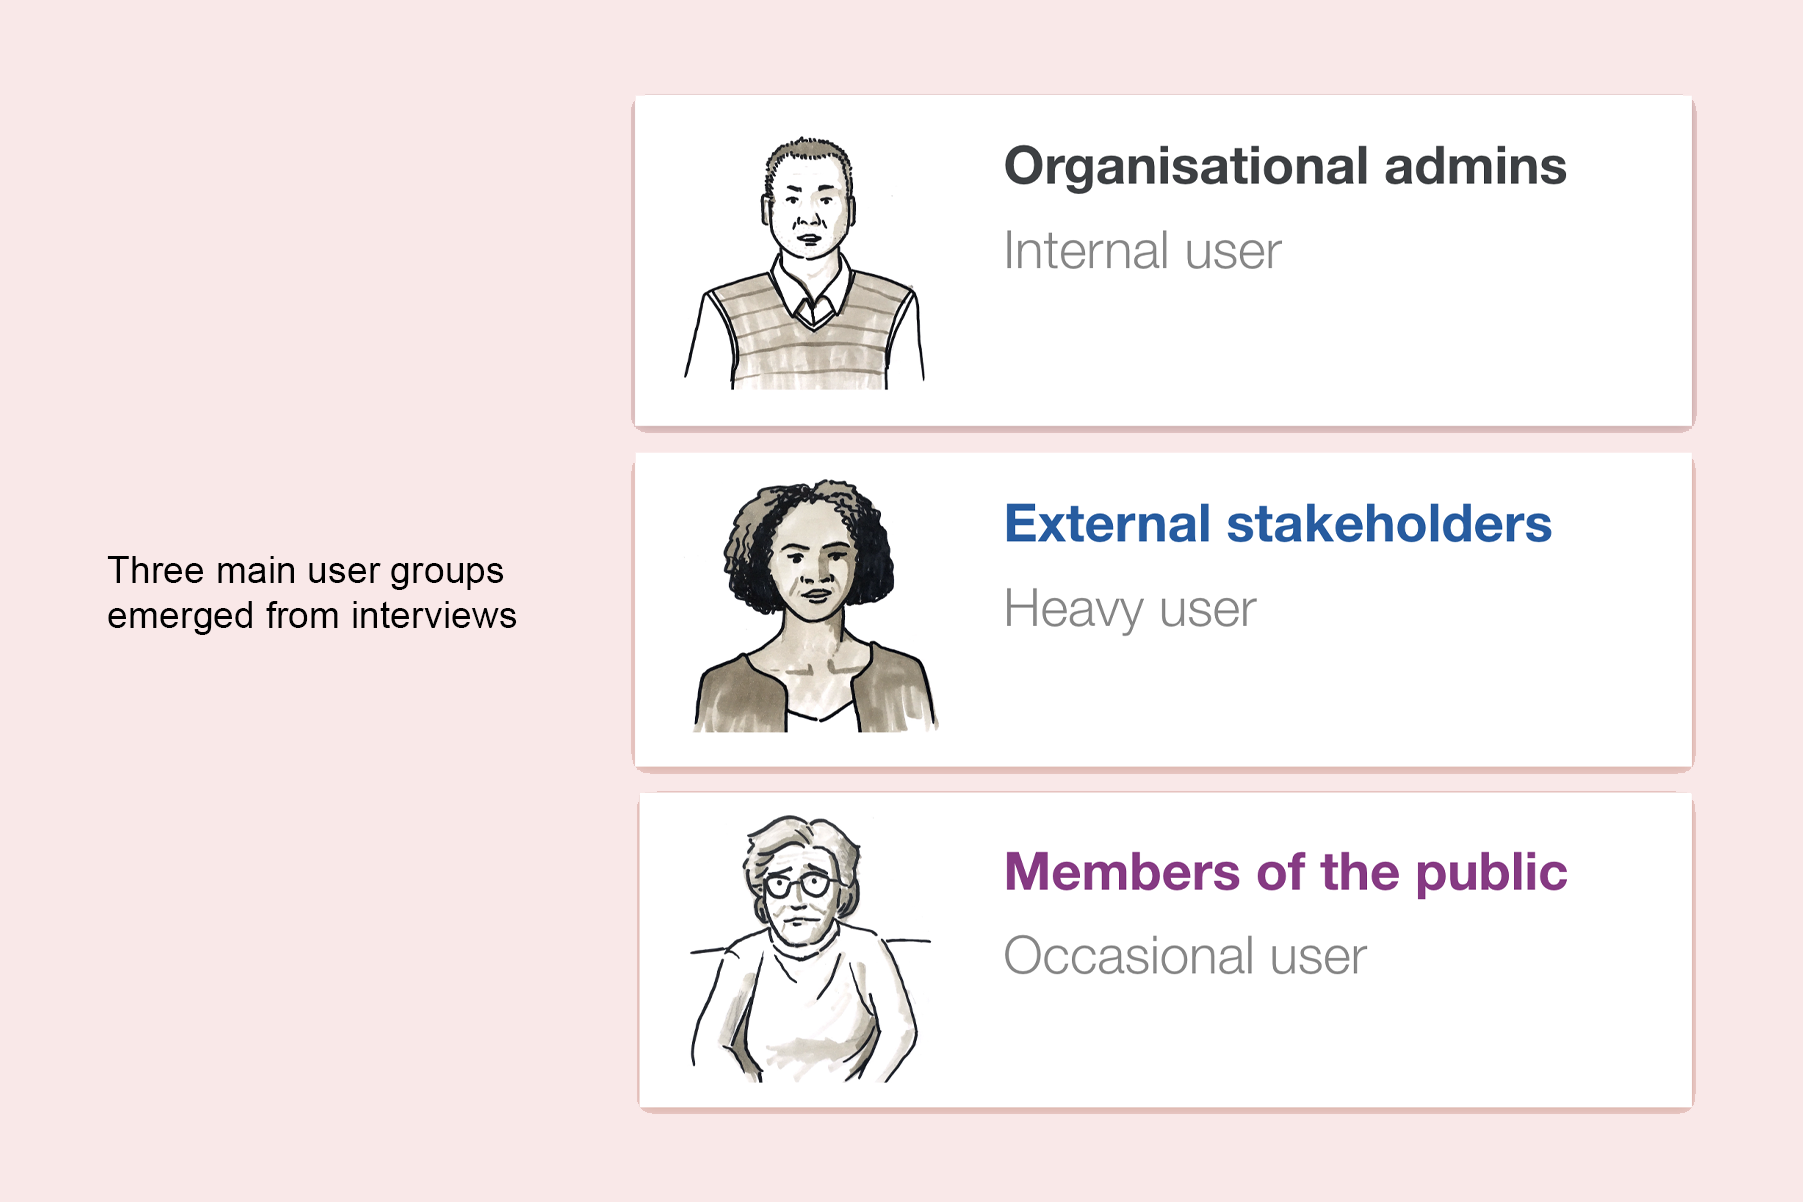
Taking our predefined user groups as a starting point, I employed a few methods of reaching appropriate users to recruit for usability testing. This included:
- Recruiting users directly: We had information on users who had previously contacted the helpdesk, participated in consultations, or communicated with the UK NSC. Inviting them to participate in user research directly was a key first approach, and meant we could test real users of the service.
- Engaging directly with stakeholders: The service had a number of registered stakeholders, who were mostly charities, research organisations or public bodies with organisational interests in the activities of the UK NSC. This meant we could recruit genuinely interested parties via an email list and regular call-outs.
- Snowballing via stakeholder organisations: A great method to connect with potentially interested users was also by communicating with stakeholder organisations and patient groups. Charities, public bodies and patient communities often had large networks and engaged audiences with a genuine interest in population health screening. Designing an invitation message to be circulated among their networks proved a successful recruitment approach.
- Specialist participant recruitment agencies: For more specialist and targeted user research, we used a research recruitment agency who specialised in recruiting user research participants. Since they have large networks across a range of user types, it meant I could draw up detailed recruitment briefs to find assistive technology users, and users with low digital literacy rates. Recruiting appropriate users in these areas tended to be a little more difficult, and so leaning on a professional agency made sure we were reaching the right people.
In order to ensure we were tracking demographics and testing across key user personas, my approach was to have potential users fill out a brief survey when responding to a call-out or invitation to participate. This meant that I could screen potential users and select the most appropriate people, making sure that we were testing a properly representative user sample. For this, I used a custom survey tool developed by PHE. This followed our organisation’s policy that sensitive information was not collected by services such as Google or Microsoft forms. The information I asked users to provide included:
- Location
- Age
- Ethnicity
- Gender
- Accessibility needs
- Self-assessment of confidence using computers (1-10)
- Self-assessment of socio-economic background
- Highest qualification of a parent/guardian/carer
- Sexual identity
- Religion
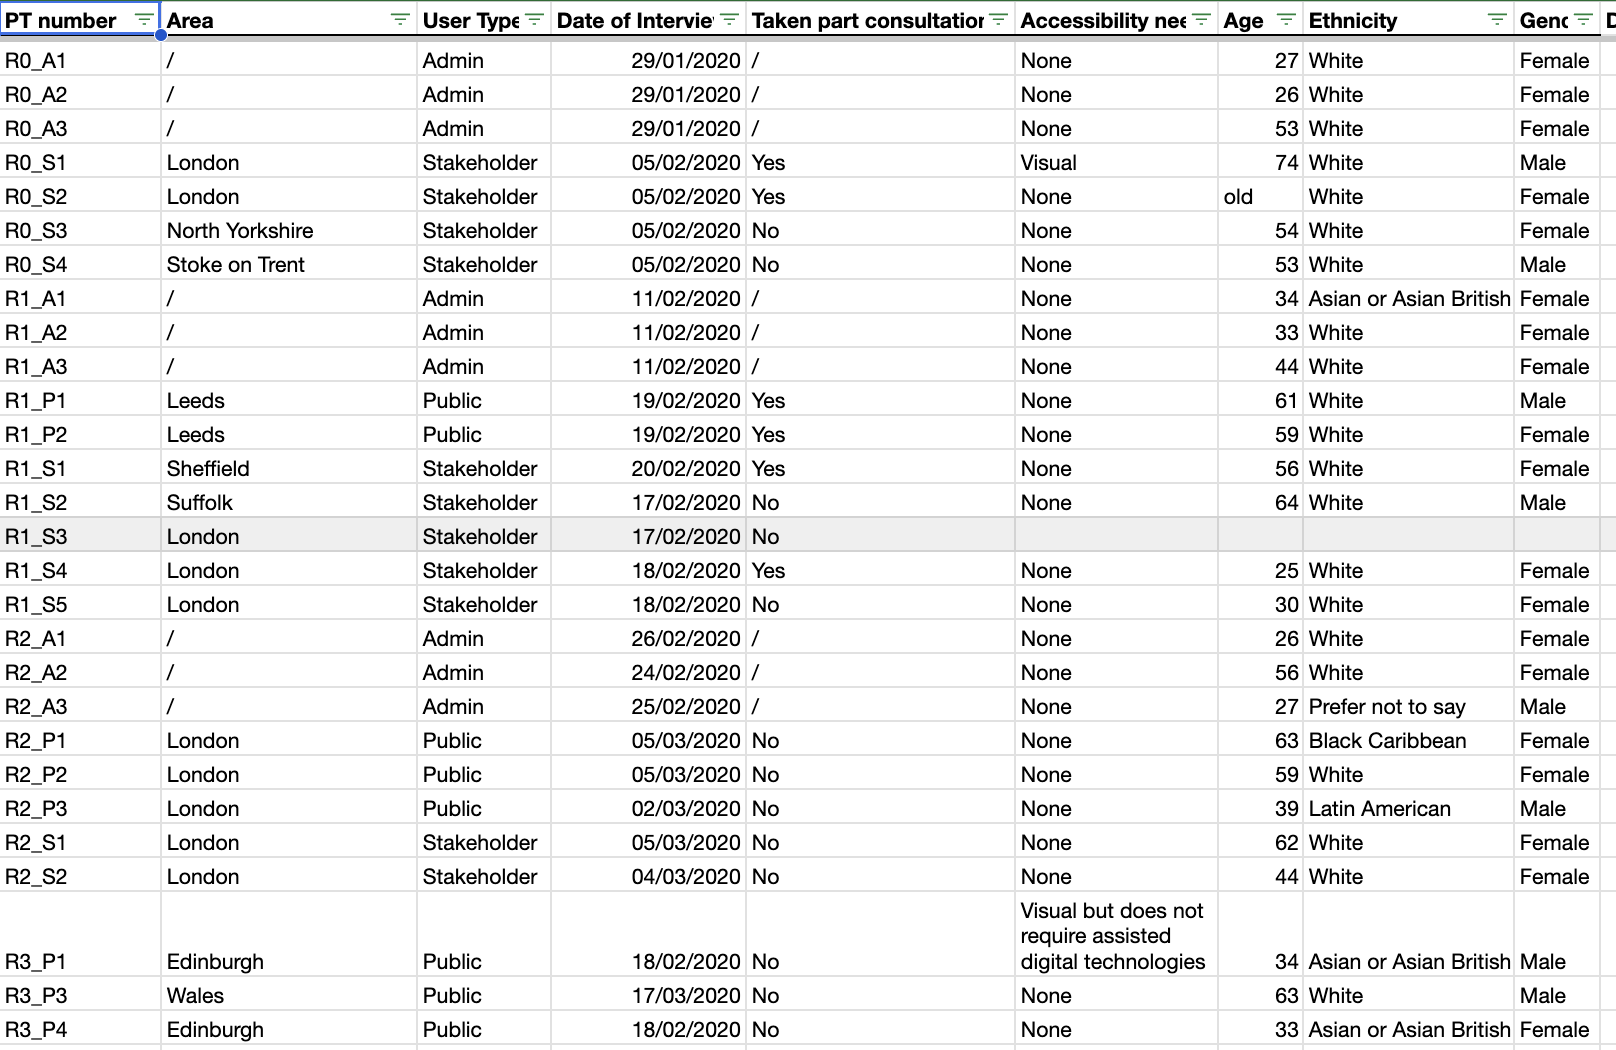
It was also important to properly present an overview of this data across the users we tested, in the form of an anonymised participant recruitment summary. This document allowed us to track all the different profiles and backgrounds of the users we tested, based on the different information we asked them to provide during the recruitment process. It was an invaluable way of ensuring that we tested users from a range of backgrounds, and meant we consistently tested a representative sample of service users from across our predefined user groups.
Supporting qualitative usability testing with quantitative methods
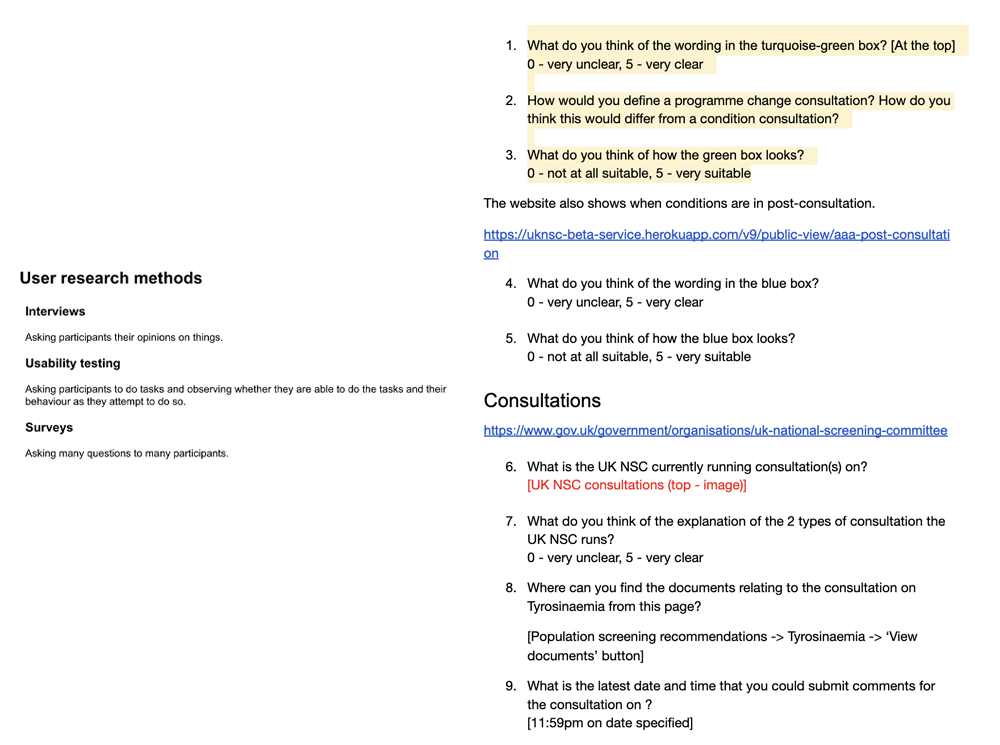
Our qualitative user research was split roughly between the following three areas:
- Interviews with users, including focus groups and content workshops: This mostly asked participants about their opinions on various aspects of the digital service.
- Usability testing across different user groups: This involved participants undertaking specific tasks on the website or prototype, and observing their behaviour and measuring their ability to complete the objectives.
- User feedback surveys: This meant designing general service-related questions and asking broader sub-sections of users.
Once we launched in public beta, on a recommendation from a senior GDS user researcher, we brainstormed whether there were quantitative methods available to us that we could use to augment our current user research approach.
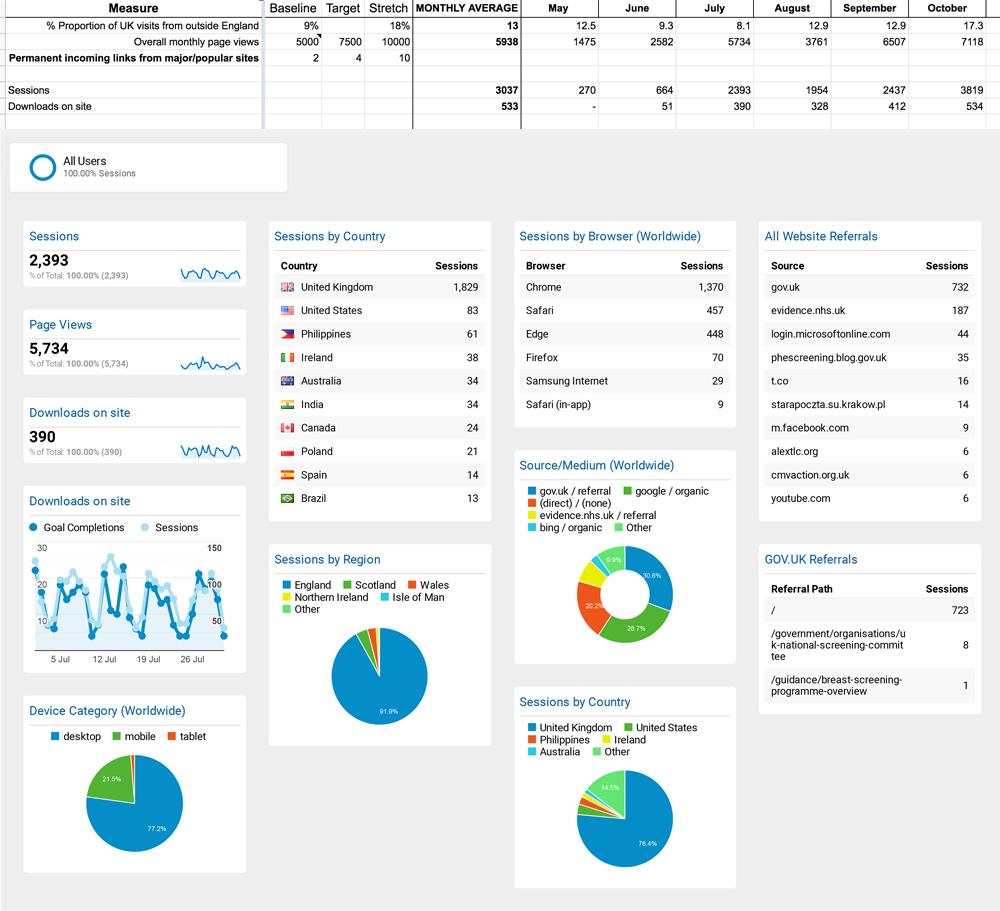
Having led the analytics tracking and reporting for the project, I suggested we look at some of the data the HotJar implementation had gathered as well as the Google Analytics dashboard, and examine whether they’re an appropriate tool to provide quantitative user research data.